Data
Financial Statements
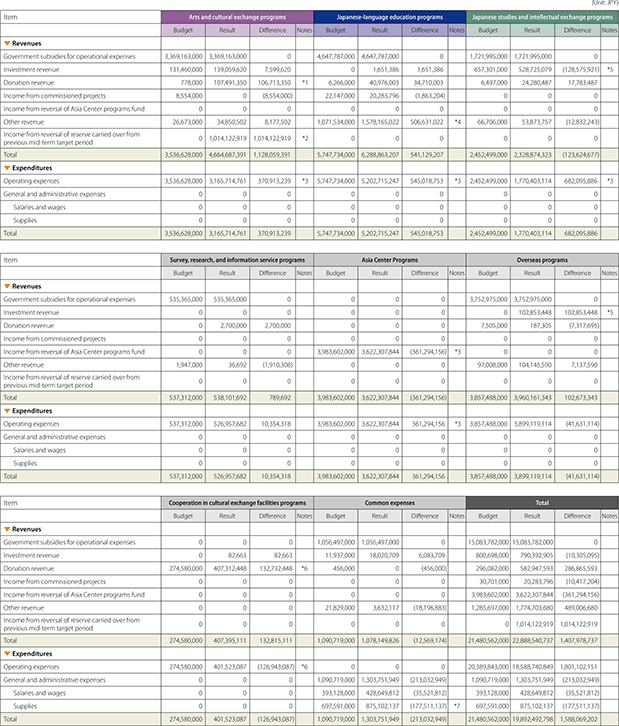
Financial Results for FY2017 (April 1, 2017 – March 31, 2018)
(Click image to enlarge)
*1. Due to increase in general donations for the Japan Exposition program received from private enterprises and other factors
*2. Due to approval of the carrying over of reserve from previous mid-term target period during FY2017
*3. Due to the fact that the implementation of some programs was shifted to FY2018 or later, and other factors
*4. Due to a portion of funds from FY2016 being deposited in FY2017 and other factors
*5. While the Center for Global Partnership is funded by investment revenue, a portion of the funding was paid out from expense for overseas programs.
*6. Due to increase in designated donations received and compensated expenditures, and other factors
*7. While a portion of the employment expense of fixed-term and other employees of the administrative departments had previously been allocated to individual departments, the expense was paid out from the common expenses segment, and other factors.
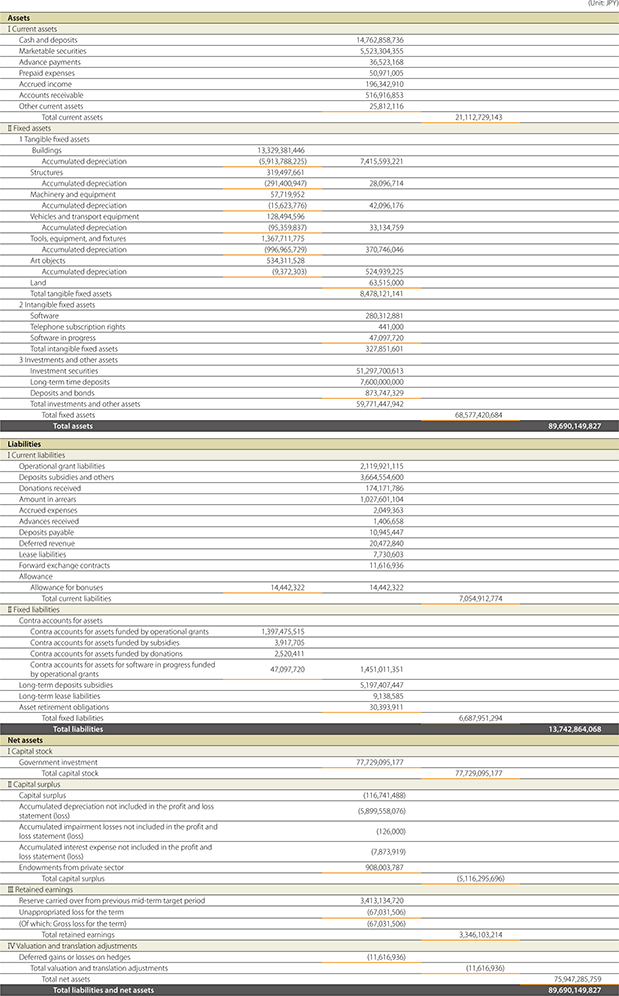
Balance Sheet (as of March 31, 2018)
(Click image to enlarge)
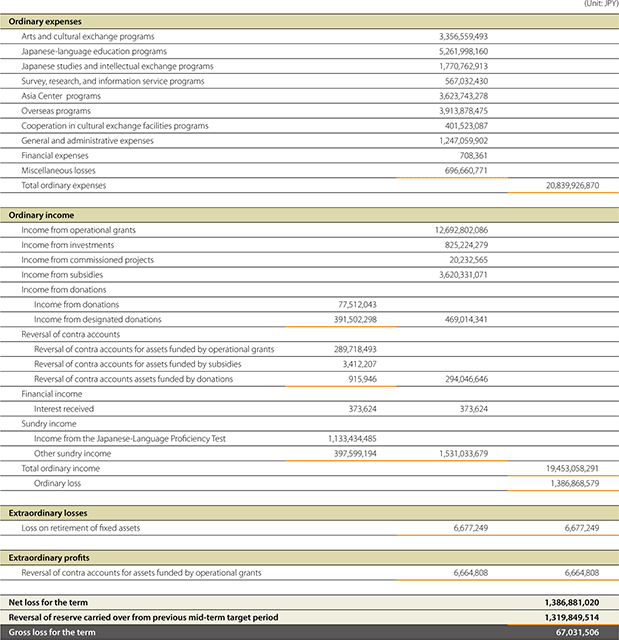
Profit and Loss Statement (April 1, 2017 – March 31, 2018)
(Click image to enlarge)
Statement of Loss Disposition (June 29, 2018)
(Click image to enlarge)
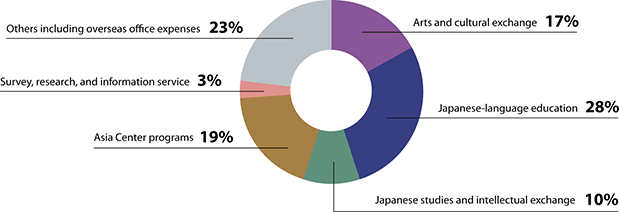
FY2017 expenditure composition ratio by project field

General administrative expenses not included。


